")
We’re excited to share a new resource now available on the IE Vital Conditions Network Space: the Community Snapshot tool. This easy-to-use feature offers quick, clear demographic and context-setting information for communities across the Inland Empire.
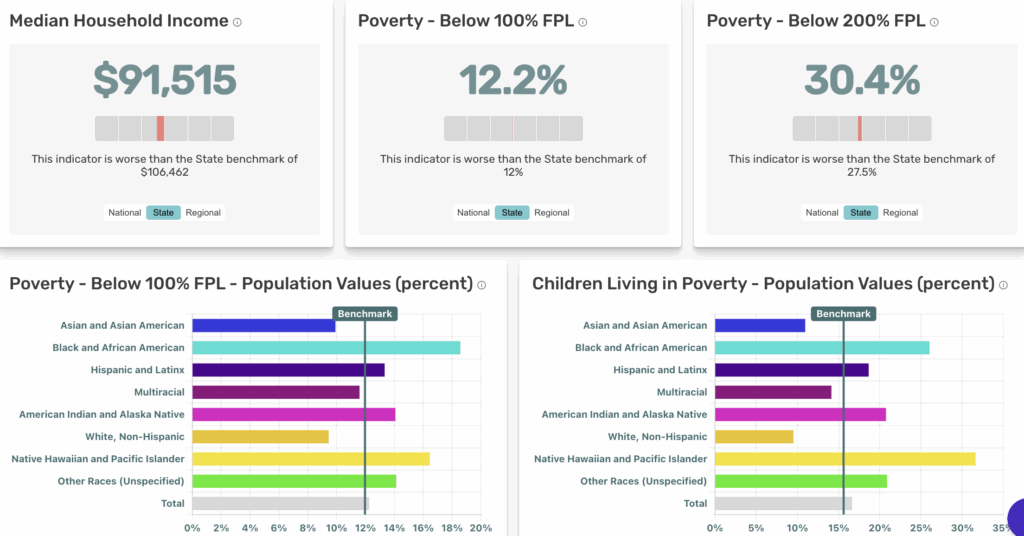
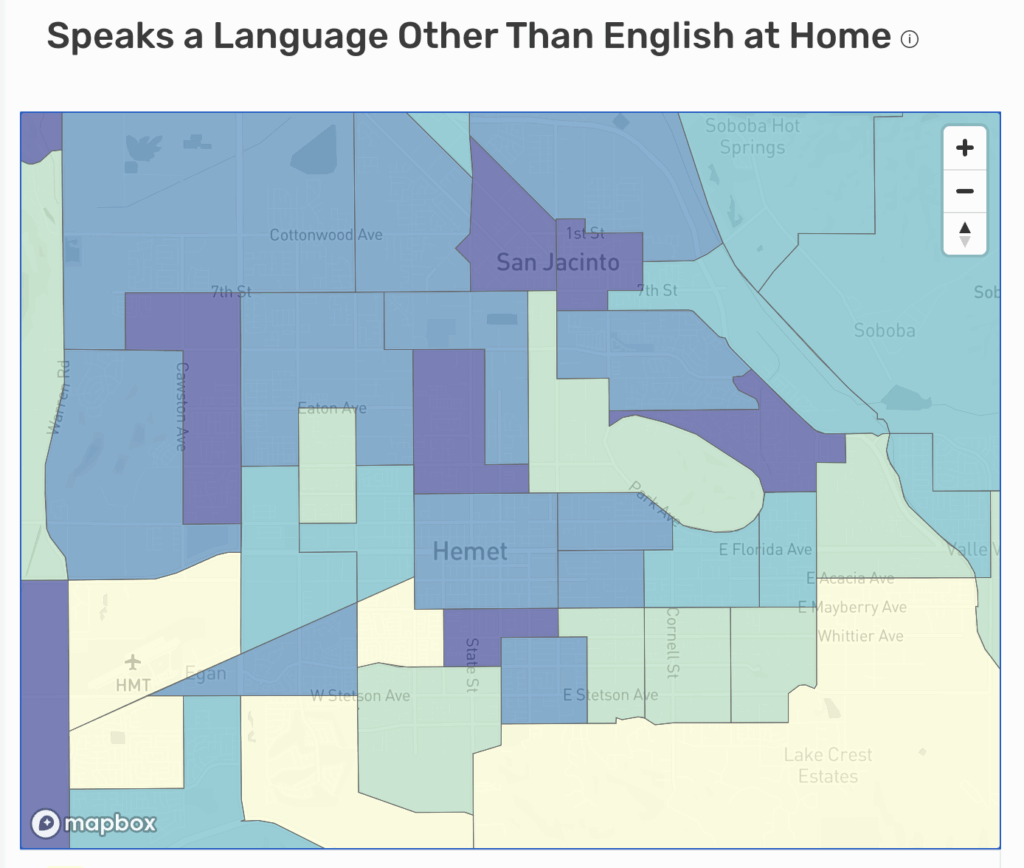
Above is a sample screenshot from the Community Snapshot report
What the Community Snapshot Offers
With just a few clicks, you can now generate a concise, beautifully formatted report for a wide range of geographies. The tool currently includes many default regions, and we can highlight additional places on request.
If you’d like to feature a specific city, ZIP code, census tract, or neighborhood within the Inland Empire, contact us and we’ll add it to the tool.
How the Community Snapshot Can Support Your Work
Partners may find this tool helpful for:
- grounding community conversations in shared facts
- orienting new staff or board members to the communities they serve
- Writing grants
- comparing conditions across places
- identifying potential areas of focus for new or emerging initiatives
- preparing for collaborative meetings where common reference points strengthen discussion
Because the tool is quick to generate, it works well for moments when you need reliable information fast.
The Community Snapshot tool was created in direct response to network requests for grab-and-go data to support their work. This dashboard provides a streamlined way to access trusted, up-to-date data without navigating multiple systems or manually compiling datasets.
A Unique Feature: Built-In Comparisons
One of the most valuable aspects of the Community Snapshot tool is the ability to see your community in context. Each report shows how your selected geography compares to:
- the Inland Empire region,
- the State of California, and
- the United States.
Toggle between the options underneath the indicator of interest. These side-by-side benchmarks help network members quickly identify patterns, disparities, or strengths. They also support clearer storytelling for grants, presentations, and decision-making by showing how local conditions relate to broader trends.

Explore the Tool
You can start using the Community Snapshot tool today:
If you’d like us to add a geography within the Inland Empire that matters to your work, contact us anytime.